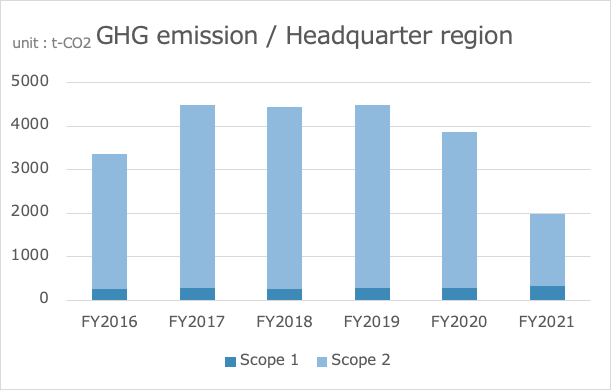
Metrics for risk management
・GHG emission
Scope 1 and 2
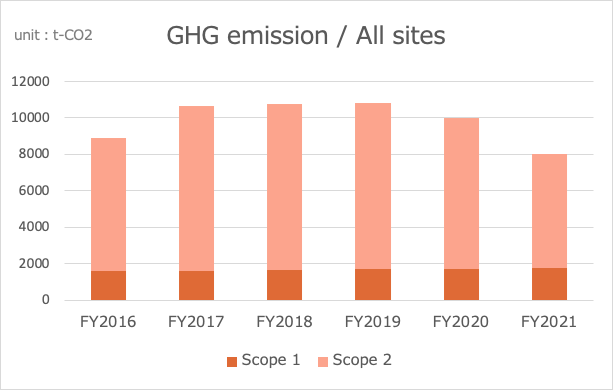
* The 'GHG Emission / All Sites' graph does not include the emission figures of the subsidiaries listed below:
* LUCK'A and Microtech.
However, we are considering calculating and including those numbers as well.
* Please note that the emission figures are subject to change due to updates in the calculation scopes or factors used.
* We will be preparing scope 3 data under specific conditions for disclosure.
View our Basic Philosophy on Corporate Governance and Corporate Governance Report.
See Mimaki's climate-related strategy in the framework of TCFD.
See how Mimaki manages climate-related risks in the framework of TCFD.
- Metrics and Targets
See Mimaki's metrics and targets in the framework of TCFD.